
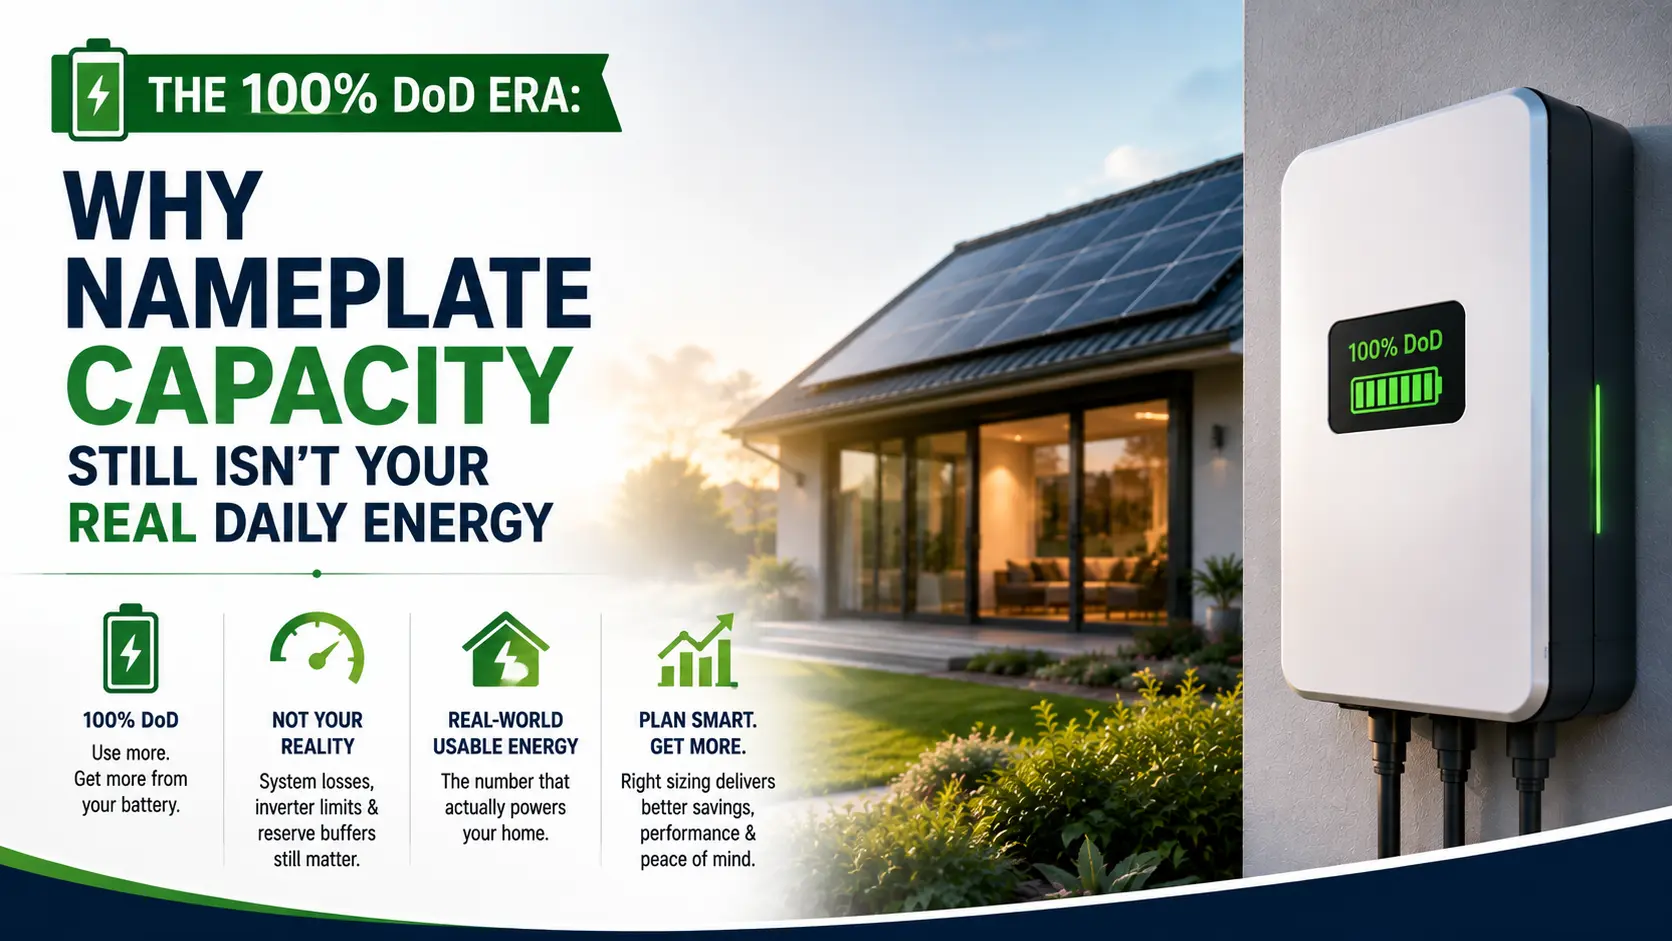
When a company sells you a 10 kWh battery, you naturally assume you’ll get 10 kWh out of it most nights. Well, that hadn’t been the case for Australians (and other solar battery users) for the past decade. The older batteries had less than 100% Depth of Discharge (DoD). This meant your battery’s actual daily output was less than the nameplate from the start.
Many customers felt the manufacturer had tricked them when they found this. As a result, the companies made their best effort over the years to solve this issue. In 2026, most of the mainstream battery brands in Australia are offering 95%-100% DoD in their new models.
However, many user still notice that their brand-new batteries are not delivering according to the nameplate. So, what’s still eating into daily energy? Our Aussie Solar Tech Team has found the most important reasons, many of which you may not have considered before.
DoD Before 2026: The Gap Between Nameplate and Usable Capacity
To put it bluntly, DoD is the actual percentage of a battery’s nameplate capacity you are allowed to use. It’s a protective mechanism that keeps the battery from burning out before its normal lifespan.
You see, the manufacturers weren’t lying. They did package a battery with the exact raw capacity claimed on the nameplate. However, they also put a bottom buffer so it never discharges to absolute zero. Thus, extending battery life and performance by saving it from full-discharge stress.
Usually, older batteries used to have a DoD rating of 80-90 percent. Suppose you bought a battery that said 10 kWh on the nameplate with a DoD rating of 90%. So, instead of handing you 10 kWh/cycle, the battery actually delivered 9 kWh per cycle.
The companies cleverly disclosed the gap in the fine print because they knew most buyers wouldn’t bother past the nameplate capacity. Plus, the average buyer was not very likely to know about DoD.
Those few kWh, although, might seem small, are not negligible. Buyers who sized systems off the nameplate figure alone often came up short on cold winter nights. And at 40¢–50¢ per kWh, even a 0.5–1 kWh nightly shortfall cost meaningful money over a year.
The 2026 Shift: 100% DoD Means the Number on the Box Is the Number You Get
Mainly two things have solved the less-than-100 % issue for solar home batteries in Australia in 2026. Firstly, advancements in cell chemistry and battery management software. And more importantly, manufacturers have taken a more honest and client-first approach in how they do business.
Have a look at all the recent products from top solar battery brands in Australia. Almost all of them offer 100% DoD. Which means you don’t have to multiply the nameplate capacity by 0.8 or 0.9 anymore to figure out your actual capacity. What the nameplate says is what you get in 2026.
| Battery | Nameplate / Usable Capacity | Marketed DoD | Performance Warranty | What This Means Practically |
| Tesla Powerwall 3 | 13.5 kWh usable | 100% | 10 years, unlimited cycles for self-consumption/backup, min. 70% capacity retention | Full nameplate usable from day one; integrated solar inverter (up to ~20 kW DC input). Unlimited cycles for solar self-consumption/time-based control and backup. VPP/grid-trading falls under a capped ~37.8 MWh aggregate throughput |
| BYD Battery-Box Premium HVS | 5.1–12.8 kWh single stack (2–5 modules); up to 38.4 kWh with 3 parallel stacks | 100% | 10 years, min. 60% capacity retention or model-specific throughput cap | Modular sizing matches capacity to household load; parallel stacks expand total usable energy |
| Sungrow SBR | 9.6–25.6 kWh, modular | 100% | 10 years, min. 70% capacity retention (or throughput limit) in current AU terms | Among the biggest single-stack capacities; pairs tightly with Sungrow hybrids |
| Alpha ESS SMILE (G3/M5) | G3-B5 stacks ~10.1 kWh modules up to ~60 kWh+; mixed configs higher | Typically 95–100% (model-dependent) | 10 years / ~3.12 MWh throughput per kWh (approx. 3,120 cycles), min. ~70% retention | Competitively priced; confirm exact DoD and retention on the specific datasheet |
| Sigenergy SigenStor | 8–48 kWh+, modular (5/6/8/9/10 kWh module options depending on generation) | 100% | 10 years, min. 70% capacity retention or defined MWh throughput (whichever comes first) | Retention floor and throughput published clearly — check against your exact module count |
“100% Usable” Is a Software-Defined Illusion Built on Hidden Physical Buffers
If DoD has become 100%, then what is protecting the battery now from the stress of full discharge? Well, it’s still there. Advanced chemistry and BMS mean the batteries are better at dealing with the stress, but they are not invulnerable to it. The manufacturers are able to give you 100% because now they are making the sacrifice the clients used to make.
The brands in 2026 are marketing net or true usable capacity instead of raw physical capacity. In other words, if you buy a new battery with 13.5 kWh capacity and 100% DoD, there’s a high chance that the physical stack inside the casing is slightly larger than 13.5 kWh, maybe 15 kWh.
So, the chemical buffer is still there, and it’s still reducing the kWh/cycle. However, this time the output matches the claims on the nameplate.
One of the reasons the newer batteries are more immune to deep daily cycling is the chemistry. Almost all the major brands have shifted from using Nickel Manganese Cobalt (NMC) to Lithium Iron Phosphate (LFP), which is better at handling deep cycling. Plus, the newer BMS has more granular control over the battery’s internal chemistry.
What Actually Eats Into Your Daily Energy in 2026
So, DoD isn’t what’s eating away at your net capacity anymore. However, Australian homeowners still notice their battery isn’t delivering what was promised. A list of factors is responsible for this. Here are the most important ones, with what you can do to fix them.
Round-Trip Efficiency
Even with near-100% DoD, roughly 8–15% of your power can vanish as heat during charging and discharging due to internal resistance plus conversion losses. This is known as round-trip efficiency.
Complete residential systems (especially AC-coupled) often land in the 85–92% overall range, while round-trip efficiency for pure DC batteries can be higher.
Fix: choose pairings rated for strong system efficiency, and install the battery in a shaded, temperature-controlled spot.
Solar Inverter Conversion Loss
Solar and batteries store power as DC while Australian appliances and the grid run on AC. This conversion from DC to AC loses a few percent per step. In DC-coupled hybrid systems, solar can feed the battery more directly, reducing one conversion leg.
Fix: use a hybrid inverter engineered to minimise conversion steps, sized to your peak loads.
Backup Reserve
Most homeowners set a 10–20% software buffer to keep lights and the fridge running through a blackout. That reserve sits inside the battery but is held back from everyday cycling. Thus, the working capacity shrinks by whatever percentage is dialled in. Modern apps let you adjust it freely, often down to 0%.
Fix: check your area’s outage history, and dial the reserve down (e.g. to 5%) if blackouts are rare. Learn more about solar battery’s minimum reserve level.
VPP Dispatch
Joining a Virtual Power Plant speeds payback through high export tariffs, but the operator can actively discharge your stored energy to the grid during high-price events. This earns you credits but will temporarily reduce what is available for home use.
Fix: review VPP contract terms for minimum reserve guarantees, and pick lighter dispatch tiers if independence matters more than export credits.
Chemical Internal Resistance & Power Limits
Forcing lithium ions rapidly between electrodes creates friction that converts electricity into heat. High simultaneous draw can cause voltage sag. The battery management system protects the chemistry by prioritizing continuous and peak power ratings (typically 5–11.5 kW depending on the system).
Fix: spread heavy appliance use across longer windows, and keep charge/discharge rates moderate.
Normal Battery Ageing and Degradation
Even with good use, lithium cells lose capacity over time through irreversible chemical change. Modern LFP systems under normal conditions typically see around 1–1.5% annual loss (higher figures apply more to older NMC chemistries). A 14 kWh battery might hold roughly 13.5–13.7 kWh after a couple of years.
Fix: buy a brand with a strong warranty (70%+ retention at 10 years preferred for rebate eligibility), and keep temperatures moderate to slow the decay.
Phantom Standby Consumption
The BMS, communication links, safety sensors, and Wi-Fi modules run 24/7 to monitor health and talk to your app, chipping away at your daily total even while nothing else draws power. Apps usually show aggregate figures rather than isolated milliwatt-level draws.
Fix: keep firmware updated for better low-power sleep states.
Active Thermal Management
Australian heatwaves and cold nights trigger internal fans, heaters, or liquid pumps to keep the chemistry safe. When solar is producing, the system can often draw from solar first; otherwise it taps stored energy.
Fix: install in a well-insulated, weather-protected spot away from direct sun, and avoid extreme temperature swings.
Chemical Cycle Ceilings / Power Caps
To stop degradation under heavy stress, the manufacturer’s software respects continuous power and thermal limits, throttling output on extreme-demand days if cell stress rises.
Fix: spread consumption to avoid tripping aggressive thresholds; the battery’s continuous rating is the hard limit — extra solar does not raise it.
Cable and Wiring Resistance
Electricity through copper wiring loses energy as heat, more so with longer or thinner cabling. Australian installation rules (AS/NZS 5139 and related) set strict requirements on cable size, length, conduit and fire barriers.
Fix: use correctly sized heavy-gauge cabling from a certified electrician and keep runs as short as compliant design allows.
Can You Change DoD on an Older Battery?
A straight and short answer is no, and you should not, even if you figure out some kind of hack. The physical cell floor is protected by the BMS, which is not adjustable by the user. Only the backup reserve level is what you can manipulate.
On many systems, the daily usable window is controlled by the backup-reserve or minimum SoC setting in the app or installer menu. Raising the reserve reduces the depth you cycle daily.
Older/generic modular batteries paired with third-party hybrid inverters have settings such as “Minimum SOC” or “On-Grid Cut-Off SOC” live in the inverter’s installer menu (password-protected). So, not you, but the installer might be able to adjust it.
However, on tightly integrated modern hardware, the BMS still enforces absolute voltage limits that the user and not even the installer can override.
Pushing beyond recommended operating windows can accelerate degradation and may affect warranty coverage if it involves unapproved firmware or physical tampering.
Retention Floors and Throughput Caps: The New Numbers Worth Checking
With DoD no longer a meaningful point of difference, the capacity retention floor and throughput cap in the performance warranty now do that job — they show how much capacity will still be there in year eight or nine, and vary between brands.
The capacity retention floor is the minimum percentage of original capacity guaranteed at the end of the warranty term.
Brands like Tesla, Alpha ESS, Sigenergy, and current Sungrow AU terms typically guarantee a 70% capacity retention floor. On a 13.5 kWh battery, that is the difference between roughly 9.45 kWh and 8.1 kWh on the coldest night of year ten — a gap that never shows up if you only compare headline DoD figures.
The throughput cap works alongside it, capping total lifetime energy covered — typically in MWh or cycle count — rather than years alone. Sigenergy pairs its 70% retention with a defined MWh throughput; Tesla removes the cycle cap for self-consumption and backup but applies ~37.8 MWh for VPP/grid-trading use.
| Brand & Model | Capacity Retention | Floor / Limit Details | Throughput Cap / Cycle Rules |
| Tesla Powerwall 3 | 70% | 10 Years | None for standard home use. VPP/grid-trading ~37.8 MWh aggregate |
| BYD Battery-Box Premium HVS | 60% (check current letter) | 10 Years | Model-specific MWh throughput cap |
| Sungrow SBR / SBH | 70% (current AU performance terms) | 10 Years | Throughput or cycle limit (confirm model) |
| Alpha ESS SMILE (G3/M5) | ~70% | 10 Years | ~3.12 MWh per kWh (approx. 3,120 cycles) |
| Sigenergy SigenStor | 70% | 10 Years | Module-specific MWh (e.g., ~15.85 MWh for 5 kWh-class, higher for larger) |
Key Questions to Ask Your Installer
- What’s the exact retention percentage, and is it tied to years, cycles, or throughput?
- Does VPP participation change the warranty cap?
- Does the manufacturer publish explicit figures for your exact module count — not just the range?
Final Word
DoD isn’t holding your battery back the way it used to. What’s eating into your daily energy now is a shorter, more specific list — backup reserve, any VPP commitment, the chemistry and power ceiling your battery was built around.
There is also the slow drag of ageing, heat, wiring and installation quality underneath it all. The best way to reduce the effect of these factors is professional installation following strict protocols. Aussie Solar Tech team has helped hundreds of Australian homes with that, and we can help you. Get in touch with us today.
FAQs
How does cell voltage balancing inside the BMS affect actual usable capacity as a battery ages?
As modules age unevenly, the BMS caps total pack capacity to protect the weakest cell in the stack. Even with high advertised DoD, small voltage imbalances can trigger early “empty” signals before healthier cells have finished draining.
Why does cold winter weather temporarily reduce the usable capacity of a lithium battery?
Cold slows chemical reactions and drives up internal resistance. Modern BMS units dynamically adjust charge rates, discharge thresholds, and usable windows in low temperatures to protect the cells (preventing lithium plating, for example). The effect feels like a temporary cut to overnight usable energy.
Does charging my solar battery to a lower maximum state of charge extend its usable lifetime?
For older NMC chemistries, yes — capping maximum charge reduced stress. For the LFP cells that dominate the 2026 Australian residential market, regular full charges to 100% are usually recommended by some experts so the BMS can perform accurate cell balancing and calibration. Check the manufacturer’s guidance for your specific model.
What is the difference between software-defined usable capacity and physical cell depth of discharge?
Software (or marketed) usable capacity is the accessible energy window your app and rebate calculations use — now typically 100% (or 95–100%) of the advertised kWh figure. Physical DoD tracks actual chemical drain inside the cells. Manufacturers build hidden buffers below the displayed 0% to block destructive over-discharge while keeping the readout clean. Rebate and STC calculations use the published usable kWh value.

Shah Tarek is a Solar Energy Consultant with 10 years experience in solar system design and solar consultancy field at Australia. He is now a Director, Operation & Consultancy Division at Aussie Solar Tech, a leading Australian solar retailer and installer. Here he is writing informative and engaging solar content that educates the community on the benefits of solar power. His work supports Aussie Solar Tech’s mission to promote sustainable energy solutions and foster a greener future for Australia.











Seraphim Solar Panels Review: Efficiency, Reliability, and Value Unveiled

Talesun Solar Panels: Honest Review Before You Buy

Sungrow Battery VS Tesla Powerwall : Which is Best in Australia?

Leapton Solar Panels Review: Affordable Energy Solution

REC Solar Panels Review: Outstanding Efficiency & Durability

Best Hybrid Inverters for Home Solar Systems in 2025

Best Solar Battery In Australia 2026 — Complete Guide

Sigenergy VS Fox ESS Battery: Which is The Best Choice for 2026

How Much Do Solar Panel Costs in Australia? (2026 Price Guide)

